nTrace
A minimal-overhead, light-weight, portable profiling library and visualization tool to track execution times and system events including operating system calls, network messages and custom events.
Simple, low-overhead ProfilingnTrace is a highly portable profiling library. Written in C++ with no OS dependancies or kernel access. It can be left alone in a production system, configured with no execution time penalty, or even compiled out as-needed with zero memory footprint. Also, you have access to its complete source code (just a couple of files), which is crucial for use online in production systems. Oh, by the way, it works really well with nForge for data analysis, dashboard building and visualization, and with nVision for worst-case response time analysis and schedulability test.
|
Why yet another profiling tool?Don't get us wrong, we are a big fan of LTTng and many other profiling libraries that ship with traditional RTOSs, and geek out on them all day. Since most real-time systems use a real-time operating system, with well configured OS kernel with limited overhead, these solutions can be an overkill. And you lose portability across OS!
|
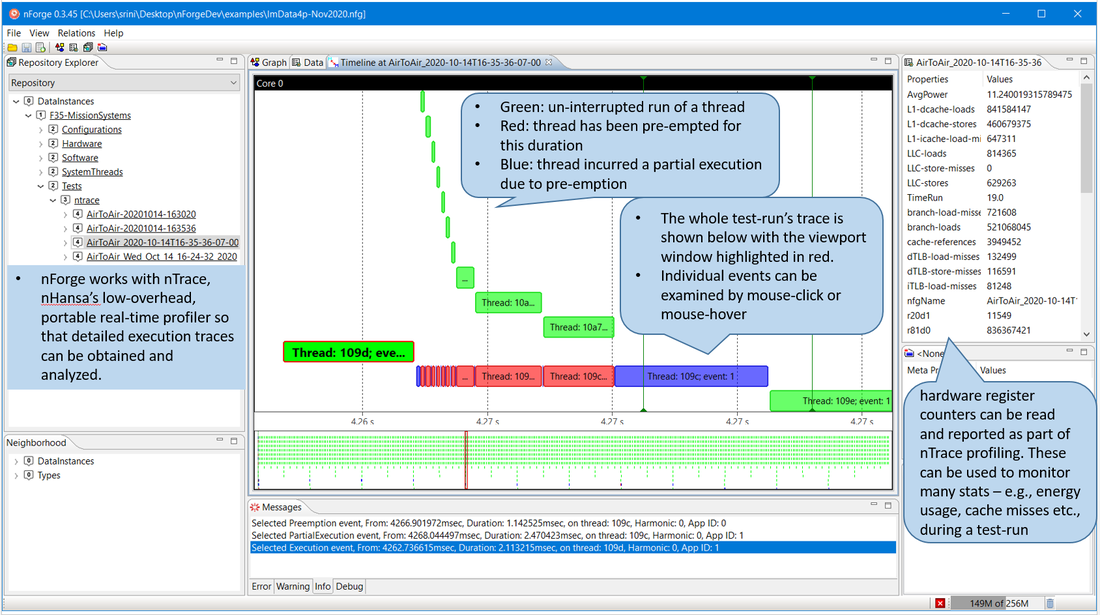
Identify startup troubles, or perform overload analysisFollowing is a snapshot of an nTrace session, showing a low priority thread being starved out by recurring high priority threads (in green bars). While this is fairly normal, execution traces are incredibly useful in diagnosing startup troubles, or overload mis-handling in real-time systems.
|