nVision
Discrete event simulation and schedulability analysis for simple and hypervisor architectures.
So why should I care about Resource Contention?Whenever you use computing resources (e.g., CPU cycles, network bandwidth, disk bandwidth), be aware that they all are inherently limited. Sure - it may not look like there are any limits, with modern processors with several cores. Here is a short story on what happens with resource conflicts. Your project is likely significantly more complex, with many more resources and tasks with complex interactions, but the basic idea is the same. Oh, by the way, using multiple cores is not a panacea and may introduce its own issues - the motivation for the nLoad solution.
|
What is RMARate-Monotonic Analysis (RMA) is a way to analyze multiple tasks for schedulability when they contend for resources. Here is a simple light-weight schedulability model and test. nVision expands this model, incorporates modern architectures, such as virtualization and multi-level scheduling, as well as discrete event simulation for estimating average response times.
|
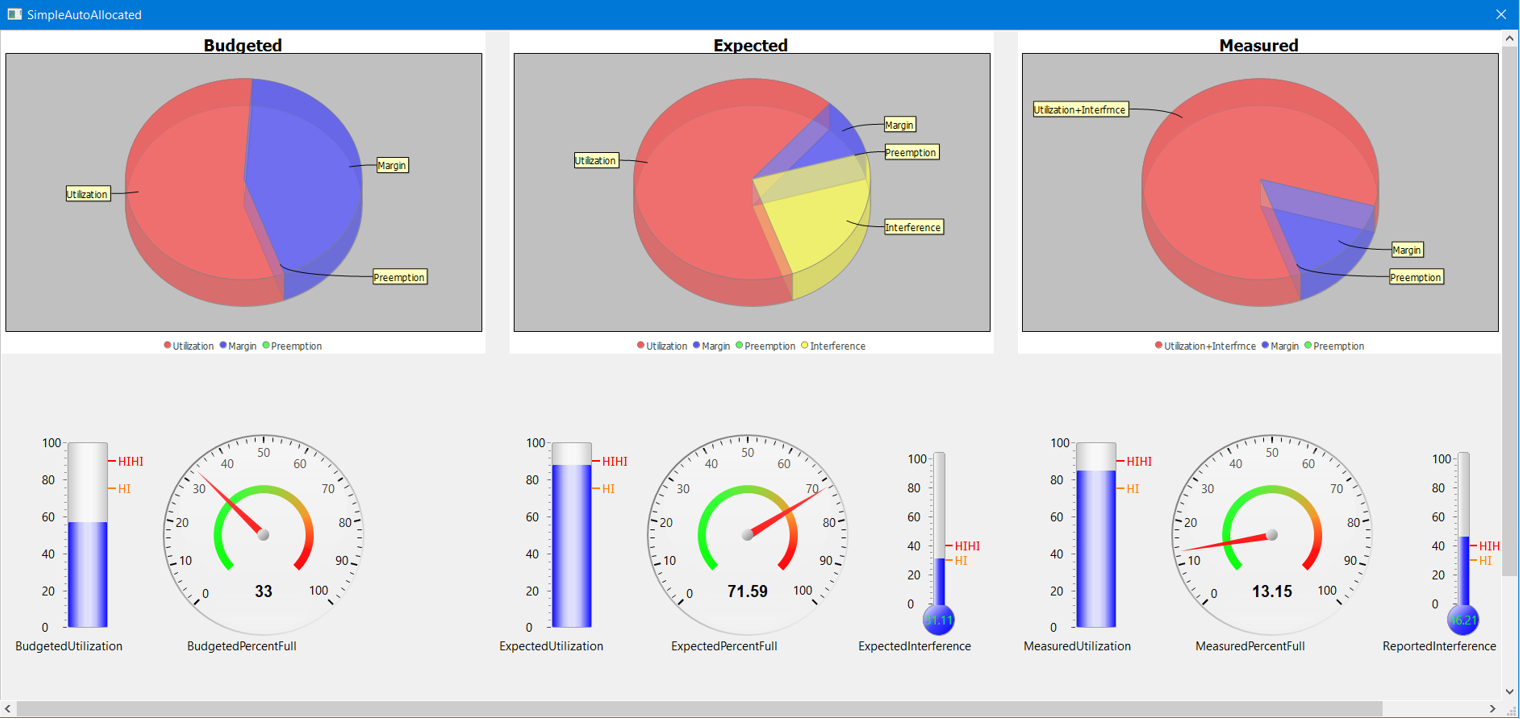
Sample Insights from nVisionIn addition to answering the key question of schedulability (required for certifying most mission-critical systems operation), nVision can break down the resource usage patterns into Execution, Pre-emption, Blocking (due to shared logical resource usage) and Interference (due to multicore). Here is a sample dashboard, with the first two charts showing the analysis results (with and without multicore use) even before the system was built, and the last chart showing a snapshot from lab measurements; oh, by the way, nTrace can help you measure these in the lab, and nForge can help you keep all this data in sync, and help you query and visualize them nicely.
|